Blog Devops notes
Maptail and Logstash
2013-05-10 00:00:00 -0700
Visualizations of data in real time not only provide great lobby displays, but also allow the ops team to keep an eye on a larger picture and spot potential issues quickly.
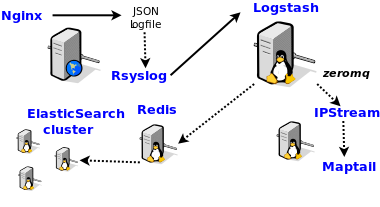
Combining Logstash with Maptail provides a great geo-located view on system access.
Example of IP traffic geolocated in real time
How to collect the necessary data

To run maptail you will need to install some software
Install the latest version of node js. You will need a later version to run maptail
sudo apt-get install build-essential openssl libssl-dev pkg-config
mkdir -p /var/tmp/software
cd /var/tmp/software
wget http://nodejs.org/dist/v0.10.5/node-v0.10.5.tar.gz
tar -zxvf node-v0.10.5.tar.gz
cd node-v0.10.5
./configure
make
sudo make install
Install maptail
sudo npm install node-gyp -g
sudo npm install maptail -g
Install zeromq libs and zeroipstream or <a href="https://github.com/shokunin/zeroipstream">get the source
sudo apt-get install libzmq-dev
wget http://shokunin.co/files/zero_ipstream.jar
Configure your logstash to serve the data streams by adding a zeromq output
zeromq {
  address => ["tcp://0.0.0.0:2112"]
  mode => "server"
  topology => "pushpull"
  tags => ["mynginxlogs"]
}
Create a configuration file for zero_ipstream, with the names/ips of the logstash servers, the port, and the field that contains ip addresses
---
    :servers:
    - 127.0.0.1
    - 172.16.15.192
    :port: 2112
    :ip_field_name: clientip
Restart logstash and start collecting data
/usr/bin/java -jar /opt/maptail/zero_ipstream.jar | /usr/local/bin/maptail -h 0.0.0.0 -p 3000Open up your browser and enjoy the show
 Shokunin Consulting LLC.